
Quick Answer
The best fintech dashboard design examples are Mercury for calm banking, Stripe for payment tables, Ramp and BILL for approval workflows, Brex for exception tracking, Wise Business for fee clarity, and Plaid for connection health. Copy one pattern: lead with the balance, show pending money, and use color only for status. If a template can’t fit your ledger or approval rules, DevSouq builds cost-efficient custom finance dashboards around your workflow, and offers a free scope review to map your first modules.
Key takeaways
- Lead with the verdict. The best dashboards answer “am I okay?” first with a balance or net position, then show pending payments and alerts.
- Match the reference to your product. Mercury for calm banking, Stripe for tables, Ramp and BILL for workflows, Brex for exceptions, Wise Business for fee clarity.
- Reserve color for status. Green, red, and amber signal gains, losses, and warnings only.
- Treat numbers as your main typography. Tabular figures, consistent decimals, right-aligned columns.
- Design the pending state. Say where money is, what happens next, and when it arrives.
- Show data freshness. A last-updated stamp next to key numbers builds trust.
- Build to measurable standards. Text contrast of at least 4.5 to 1 and Largest Contentful Paint of 2.5 seconds or less.
- Templates cover screens only. Ledger logic, approval rules, integrations, and security decide the real cost.
What should a fintech dashboard show?
Strong fintech dashboards follow the same top-to-bottom logic. Check your layout against this order:
- A verdict row. Total balance or net position with a trend. It uses the largest type on the page.
- Money in motion. Pending payments, transfers in flight, and items awaiting approval. Anything that will change the headline number sits beside it.
- A cash flow view. Income against spending over time, with a period comparison.
- A transaction table. Dense, filterable, and sortable, with merchant, category, amount, and status.
- Alerts and exceptions. Failed payments, low balances, and policy flags, shown on the main view and not buried in a tab.
Each product type adds its own layer:
| Product type | Extra widgets it needs |
|---|---|
| Trading and investing | Portfolio P&L, allocation, watchlist, buying power |
| Lending | Payment schedule, delinquency buckets, payoff quote |
| Billing | Invoice status, failed payment recovery, revenue recognition |
| Insurance | Claim queue, premium schedule, reserve tracking |
| Developer platforms | Usage meters, request logs, environment switch |
Fintech dashboards at a glance
| # | Platform | Category | Signature pattern | Study it for |
|---|---|---|---|---|
| 1 | DevSouq Technologies | Custom finance software | Scoped, purpose-built modules | Building around your own ledger |
| 2 | Mercury | Business banking | Editorial calm | Trust through restraint |
| 3 | Stripe | Payments | Tables and reporting | Data tables and drill-downs |
| 4 | Ramp | Spend management | Work queues | Workflow-first design |
| 5 | Brex | Corporate cards and spend | Exception-first views | Density at enterprise scale |
| 6 | Wise Business | Cross-border banking | Fee transparency | Multi-currency balances |
| 7 | Revolut Business | Business banking | Dark, card-based UI | Numeral legibility on dark |
| 8 | Plaid | Data infrastructure | Developer console | Usage and health states |
| 9 | Robinhood | Investing | Focused portfolio view | Simplicity for new users |
| 10 | BILL | Bill pay and payables | Approval trail | Easy bill pay workflows |
How we reviewed these dashboards
Product dashboards sit behind logins. These notes rely on public product pages, demos, and documentation, not hands-on access to every account. Verify each feature against the vendor’s current site before citing it. DevSouq is our own company, so entry 10 is labeled as a disclosure and placed last.
1. DevSouq Technologies: Custom Finance Dashboards Built Around Your Workflow

Best for: finance teams whose dashboard must sit on top of a ledger, billing engine, loan book, claims system, or portfolio data.
Every other entry is a finished product you adopt as it comes. DevSouq is a custom finance software development company that builds the dashboard and the system underneath it. That matters when your data model doesn’t fit a template. A standard product gives you its screens, workflow, and limits. A custom build starts from your ledger, your approval rules, and the questions your team asks every morning.
When custom makes sense
- You reconcile payments across several internal systems.
- A lender runs payment rules that differ by product.
- An insurer ties premiums to policy data.
- Your dashboard is patched with exports, spreadsheets, and manual checks.
Why it suits budget-conscious teams
- Cost-efficient by scope. You pay for the modules your workflow needs, not a suite you won’t open.
- No per-seat pressure. A purpose-built system isn’t priced by finance users. Confirm commercial terms in your scope review.
- Built on your rules. Approval limits, payment schedules, and reporting logic are implemented as your business defines them.
- Fewer workarounds. A dashboard reading from the system of record means less exporting and rechecking.
How to test the fit: bring your workflow, the reports people ask for most, and the systems the dashboard must read from. The outcome is a short list of modules to build first and what can stay a standard tool. See our custom finance software development page for scope review details.
Pattern to borrow: design the data model first and the screens second. A dashboard is only as trustworthy as the system of record behind it.
2. Mercury
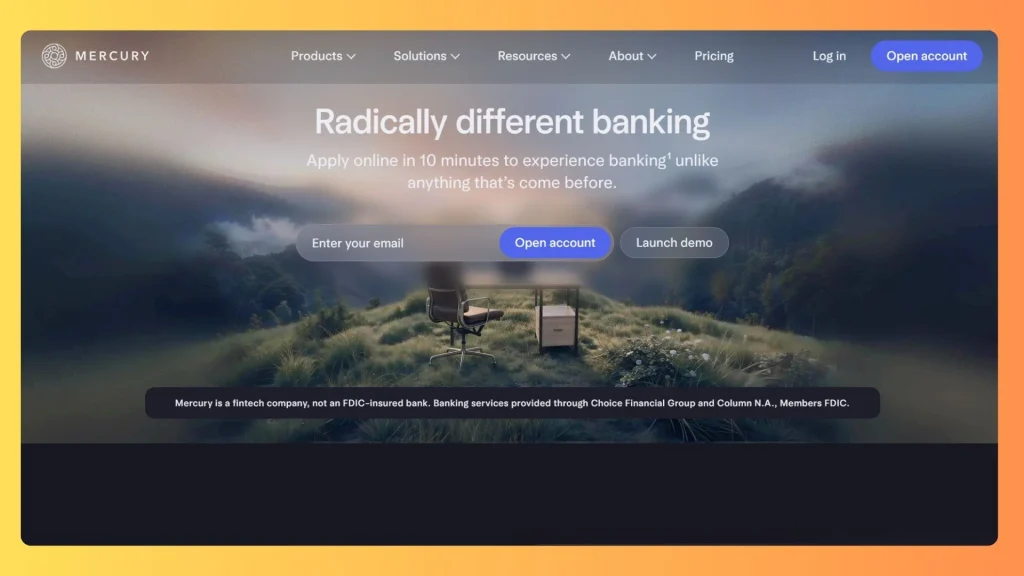
Best for: Startups and small to mid size businesses that want a calm, easy to read banking dashboard for balances, cards, payments, and team permissions, without the clutter of a traditional bank portal.
What makes it work
- A narrow palette. Color is used sparingly, so the few colored elements on screen carry meaning.
- Generous spacing. Rows and cards have room to breathe, which lowers the effort of scanning long lists of transactions.
- One consistent voice. Accounts, cards, and payments follow the same layout logic, so users learn the product once and apply it everywhere.
- Numbers first. Balances and amounts get the strongest visual weight, and supporting labels stay quiet.
| Dashboard area | What it does |
|---|---|
| Accounts overview | Balances across checking and savings with recent activity |
| Transactions | Searchable list with categories and statuses |
| Cards and payments | Card controls, payment initiation, recipients |
| Team and permissions | Role based access for finance and operations users |
| Treasury | Views for managing cash beyond day to day accounts |
Limitation: the model fits startups and small businesses well, but workflows with heavy approval hierarchies or custom ledgers need more than a banking front end.
3. Stripe
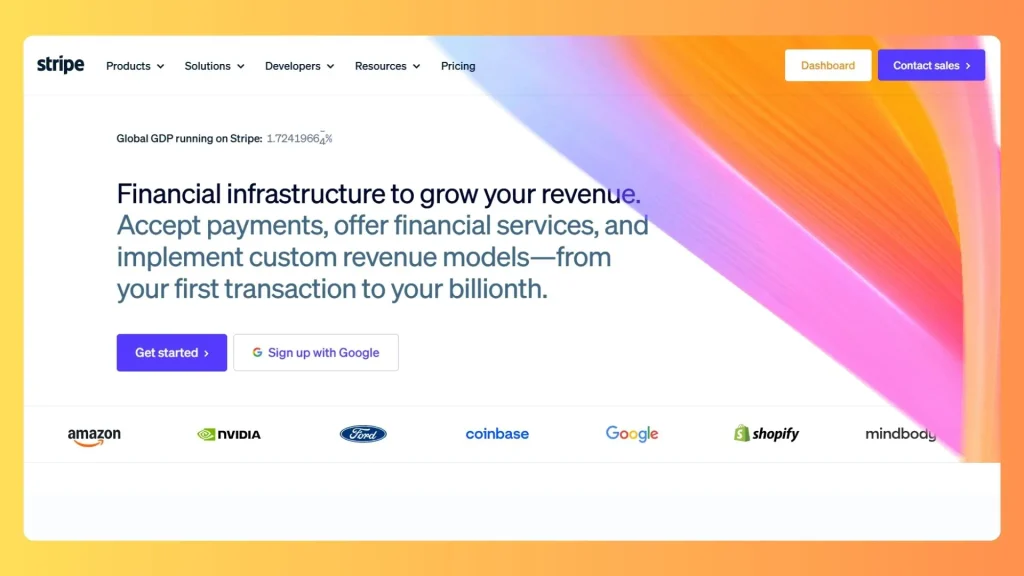
Best for: Online businesses and software companies that need detailed payment reporting, subscription and payout visibility, and developer tools such as logs and test mode, all inside one well organized dashboard.
What makes it work
- Tables lead, charts summarize. The home view gives a quick read on revenue, then lets you move straight into the underlying payments.
- Drill downs keep context. You can move from a summary into a single record and back without losing your place.
- Status chips are consistent. The same small labels appear across payments, invoices, and disputes, so users learn the vocabulary once.
- Developer tools sit inside the product. API keys, logs, and webhooks live in the same dashboard as the business data.
| Dashboard area | What it does |
|---|---|
| Home | Revenue summary, balance, recent payments |
| Payments and balances | Payment lists, payouts, fees |
| Customers and billing | Subscriptions, invoices, customer records |
| Disputes and fraud tools | Case queues and risk review |
| Reports | Exportable financial reports |
| Developers | API keys, logs, webhooks, test mode |
Limitation: the dashboard is built around Stripe’s own payments and billing model. It is not a general ledger, so teams with complex accounting needs usually pair it with other systems.
4. Ramp
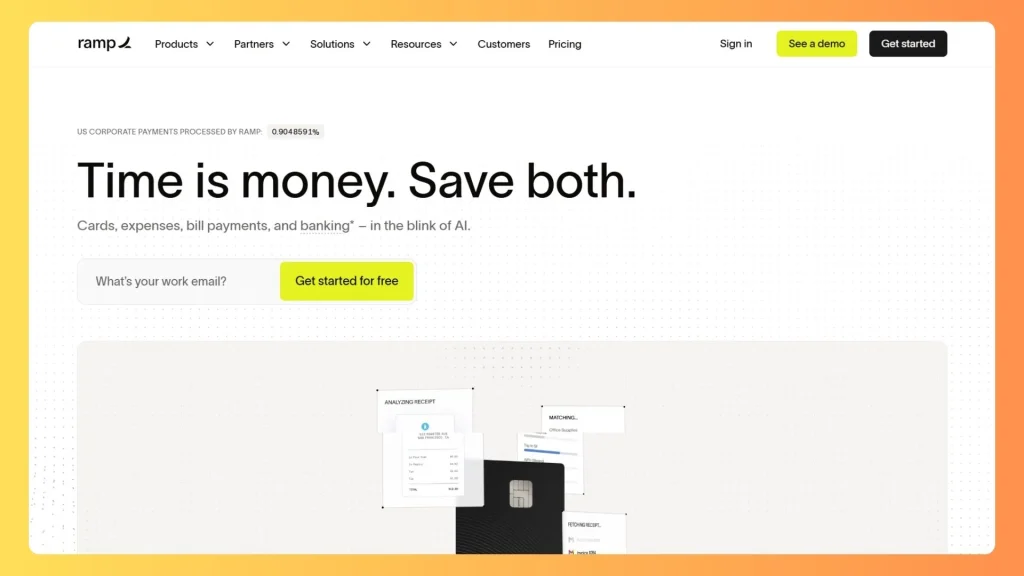
Best for: Finance and operations teams that want to control company spending, match receipts, code expenses, route approvals, and sync everything to their accounting system from a single work queue.
Why the work queue matters
Most finance dashboards start with charts and leave the work to the user. Ramp reverses the order. The first thing a finance manager sees is what needs attention today: missing receipts, items awaiting approval, and transactions that still need a category. Charts and trends sit behind that, available when someone wants context. This suits the reality of finance work, which is a steady flow of small decisions rather than occasional deep analysis.
A typical expense moves through these stages, and the dashboard makes each one visible:
| Stage | What the user sees | Owner |
|---|---|---|
| Card swipe | Transaction appears with merchant and amount | Employee |
| Receipt match | Missing receipt flag | Employee |
| Coding | Suggested accounting category | Finance |
| Approval | Item in approver queue | Manager |
| Sync | Posted to accounting system | Finance |
What to notice in the design
- Ownership is explicit. Every stage names who has to act, which removes the guesswork of who is holding things up.
- Suggestions reduce effort. Proposing a category or matching a receipt turns a manual task into a quick confirmation.
- The end state is clear. An item is finished when it reaches the accounting system, and the dashboard shows that endpoint.
How to apply it
Map your own process from the moment money leaves to the moment it is recorded. Each step where something can stall becomes a queue on the dashboard. Teams that need this kind of sync with their own ledger often end up scoping custom accounting software development.
5. Brex
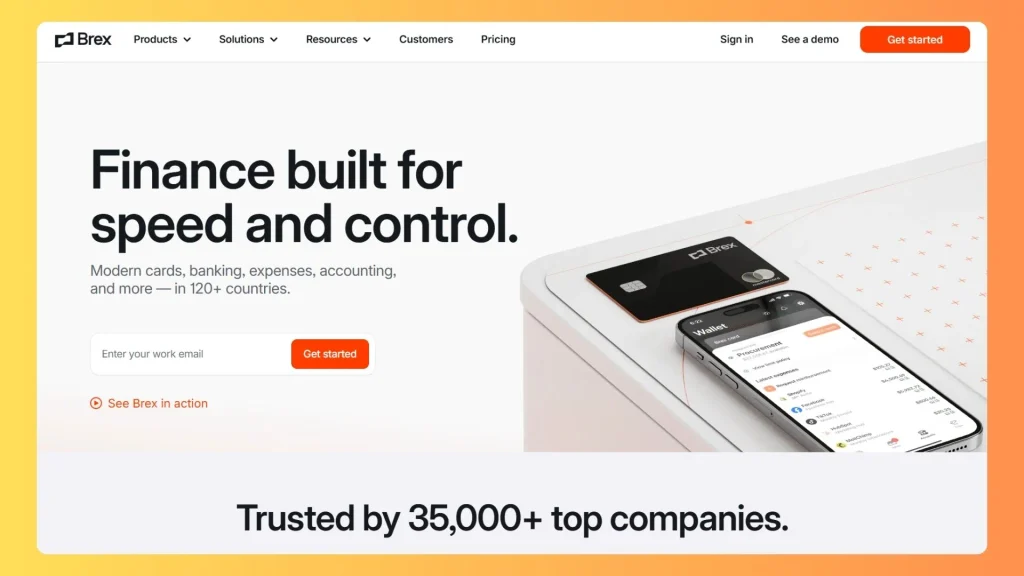
Best for: Larger companies with several teams, entities, and spending policies, where controllers need budgets, approvals, and policy exceptions surfaced quickly instead of digging through every transaction.
The problem it solves
As a company grows, the number of things a finance leader could look at grows faster than the time available. Ten teams, several entities, different currencies, and layered spending policies produce thousands of data points. Showing all of them creates noise. Brex’s approach is to define what normal looks like and then surface only the departures from it. A controller does not need to see that a team is within budget. They need to see that a team is about to go over.
| Exception type | Example trigger | Dashboard behavior |
|---|---|---|
| Policy breach | Spend above a category limit | Flag on the overview with owner |
| Missing documentation | Receipt not attached | Reminder queue |
| Budget risk | Team close to its budget | Warning on budget card |
| Unusual activity | Out of pattern merchant | Review item |
What to notice in the design
- Hierarchy over volume. Headline figures come first, and detail opens on demand.
- Every flag has an owner. An exception without a named person tends to sit unresolved.
- Filters match how the company is organized. Team, entity, and category views mirror real reporting lines.
6. Wise Business

Best for: Businesses that hold, send, and receive money in multiple currencies and want clear balance cards, visible exchange rates, and fee breakdowns shown before they confirm any transfer.
The multi currency challenge
A business that operates across borders faces confusion at every step. Which currency does this balance hold? What rate applies? What will the recipient actually receive, and when? Products that answer these questions late create anxiety and support requests. Wise answers them before the user commits, which turns a stressful moment into a routine one.
| Fee element | Why it belongs on screen |
|---|---|
| Amount sent | Anchors the calculation |
| Fee | Shown as its own line |
| Exchange rate | Stated explicitly |
| Amount received | The number the recipient gets |
| Expected arrival | Sets timing expectations |
What to notice in the design
- Balance cards. Each currency gets its own card, so users see holdings at a glance without decoding a long list.
- Itemized costs. Separating the fee from the rate lets users check the math instead of trusting it.
- A plain data layer under a strong brand. The visual identity is bold, but the numbers themselves are presented simply and consistently.
- Timing expectations. Showing when money will arrive answers the question users care about most after the cost.
7. Revolut Business
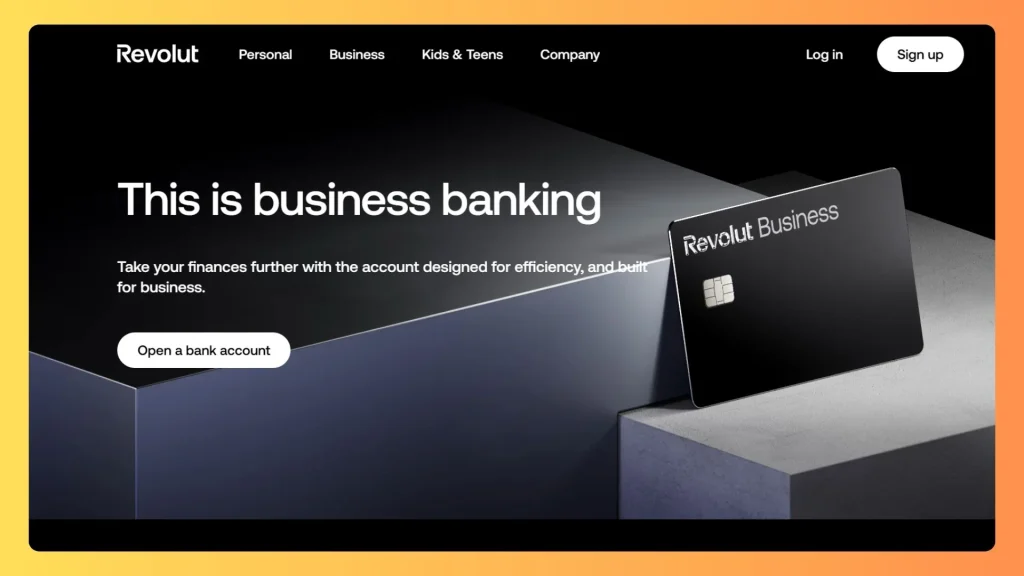
Best for: Teams that want cards, foreign exchange, spend management, and treasury in one app, and power users who spend long sessions in a dark, high contrast interface.
Why dark works here
Dark interfaces reduce glare during long sessions, and they make bright numerals and status colors stand out sharply. For people who monitor balances, exchange activity, and card spend throughout the day, that contrast helps them scan quickly. Card based panels add structure, so each product area, such as cards, transfers, or treasury, reads as a separate unit instead of one dense wall of data.
What to notice in the design
- Numerals carry the page. Large, bright figures against a dark background make balances readable at a glance.
- Panels separate functions. Cards, exchange, and spend each have their own container, which prevents crowding.
- One app for many jobs. Combining several finance functions works because the navigation stays consistent.
Where dark interfaces go wrong
| Risk | What happens | Fix |
|---|---|---|
| Small gray secondary text | Falls below readable contrast | Test against the 4.5 to 1 minimum |
| Pure black backgrounds | Harsh glare and heavy contrast | Use a softened dark tone |
| Red and green on dark | Colors lose separation for some users | Add icons or labels beside color |
| Thin fonts | Strokes disappear on dark | Use a medium weight for numbers |
8. Plaid
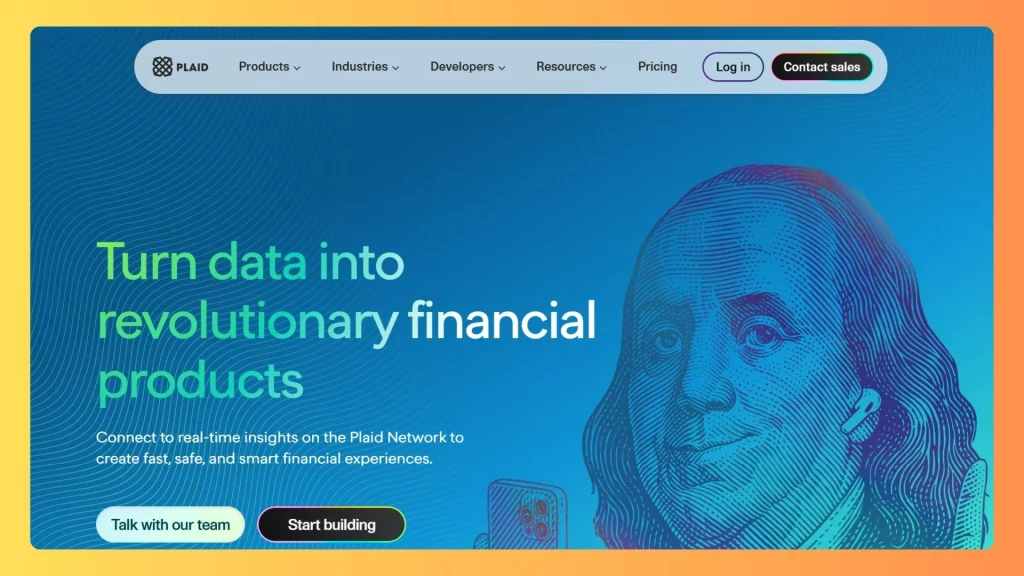
Best for: Developers and product teams building apps on top of bank data who need to monitor API usage, connection health, error rates, and separate testing and live environments in one console.
A dashboard for builders, not account holders
Most dashboards in this list face customers who want to see their money. Plaid’s faces developers who need to know whether their integration works. The questions are different: are users completing the bank connection flow, which institutions are failing, and how much of the product are we using? A useful developer dashboard answers those questions without forcing anyone to read raw logs first.
The data path behind a Plaid powered product looks like this:
| Step | Component | What the dashboard exposes |
|---|---|---|
| 1 | End user opens Link in your app | Conversion and error rates |
| 2 | User authenticates with their bank | Institution level connection health |
| 3 | Your server exchanges a token | API request logs |
| 4 | Your app retrieves account data | Usage per product |
| 5 | Your system stores and displays it | Your own dashboard layer |
What to notice in the design
- Environment separation. Sandbox and Production are clearly distinct, which prevents test activity from being mistaken for live activity.
- Health states. Connection status and error rates appear as first class information, not something buried in a report.
- Team controls. Access management sits in the same console, which matters when several engineers share an account.
9. Robinhood
Best for:New and casual investors who want a simple portfolio view, smooth interactive charts, and a low clutter layout that reveals more detail only when they ask for it.
Why simplicity worked
Traditional brokerage screens often present dozens of controls, tabs, and data columns at once. For a first time investor, that reads as a warning that the product is not for them. Robinhood answered with a clear hierarchy: your total value and today’s change first, a chart to show the trend, and your holdings below. The interface asks users to understand very little before they can see how they are doing.
| Layer | Content | Purpose |
|---|---|---|
| Primary | Portfolio value and daily change | Immediate answer |
| Secondary | Chart with range selector | Context |
| Tertiary | Holdings list, watchlist | Action |
| On demand | Order details, statistics | Depth without clutter |
What to notice in the design
- A single headline number. Everything else supports it.
- A range selector on the chart. Users switch between short and long time frames without leaving the page.
- Hover and touch feedback. Interactive charts respond smoothly, which makes data feel approachable.
- Depth kept out of sight. Advanced statistics exist but only appear when someone asks for them.
How to apply it
Progressive disclosure works best when you know who your users are. For beginners, hide complexity and reveal it gradually. For experienced investors, the opposite is true: they want density and speed. Decide which group you serve first, then set the default depth accordingly. Products with deeper needs such as allocation, rebalancing, and reporting move toward custom investment portfolio management software.
10. BILL
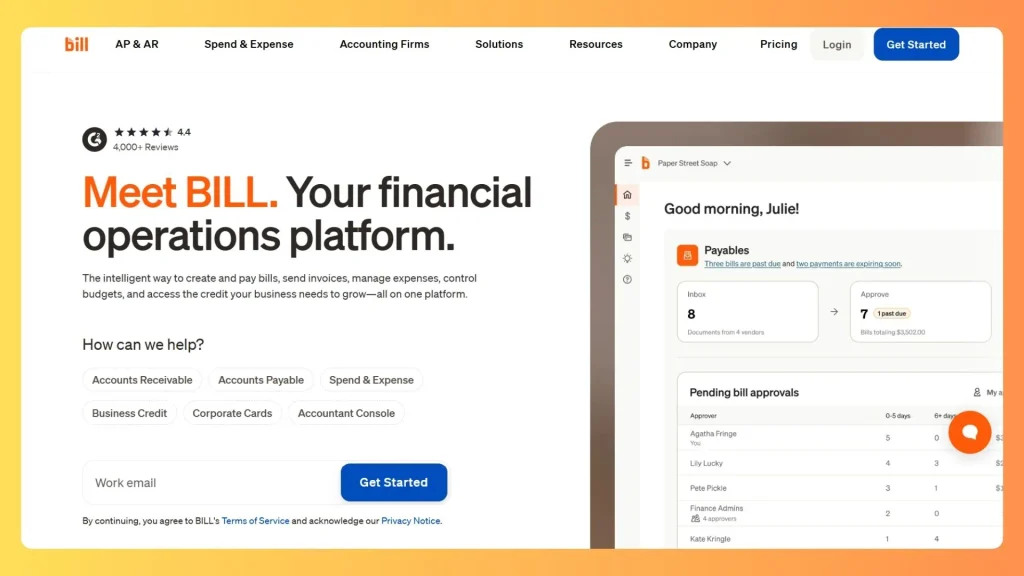
Best for: small and mid-size businesses managing payables and receivables with approval routing and accounting sync.
Paying bills sounds simple until a business has dozens of vendors, several approvers, and a due date on every invoice. Invoices arrive by email, approvals happen in chat, and someone updates the books afterward. Every handoff is a chance for a late payment, a duplicate, or a missing record. A bill pay dashboard replaces those scattered steps with one trail.
| Bill status | Meaning | Next action |
|---|---|---|
| Received | Invoice captured | Review and code |
| Pending approval | Waiting on an approver | Approve or reject |
| Approved | Ready to schedule | Choose date and method |
| Scheduled | Payment set to send | Monitor |
| Paid | Funds sent | Reconcile with accounting |
Fintech dashboard types: which pattern fits your product?
Dashboards fall into four archetypes. Pick by the user’s main question.
| Archetype | Main question | Data density | Trust signal | Examples in this guide |
|---|---|---|---|---|
| Payments and revenue | Did the payment succeed, and when do I get paid? | Upper medium | Transaction-level status | Stripe |
| Spend management and business banking | How much cash do I have, and who can spend it? | Medium | Permissions, budget vs. actual | Mercury, Ramp, Brex, Wise Business, Revolut Business, BILL |
| Investing and wealth | How is my portfolio doing? | Low to medium | Performance context | Robinhood |
| Risk, compliance, and infrastructure | What is broken, and what needs review? | High | Audit trail, diagnostics | Plaid |
Mobile vs web fintech dashboards
Many teams ask which enterprise platforms offer the best mobile and web dashboards. The better question is what each screen is for.
| Mobile dashboard | Web dashboard | |
|---|---|---|
| Job | Quick check and one safe action | Analysis, bulk work, reconciliation |
| First screen | Balance, pending items, one alert | Verdict row, queue, filters |
| Tables | Short lists, tap to expand | Dense, sortable, exportable |
| Actions | Approve, freeze a card, confirm a transfer | Bulk approve, reports, role setup |
| Risk | Fat-finger errors, small tap targets | Information overload |
Rules that hold on both:
- Keep the same status vocabulary, colors, and number formatting.
- Put high-risk actions behind confirmation steps and permission checks.
- Let a mobile user finish urgent work (approve, freeze, retry) without opening the web app.
Payment monitoring and error analytics dashboards
Searches such as “payments dashboard platform” and “real-time payment monitoring dashboard” point to a specific need: see what failed, why, and what to do next.
A strong payments dashboard shows:
- Status and volume. Succeeded, pending, failed, refunded, disputed.
- Failure reasons. Grouped, so teams can tell checkout errors from fraud or dead cards.
- Trends. Failure rate over time, by method and by region.
- Settlement timing. When funds actually arrive, compared with the payout history.
- An owner and a next action on every failure. Retry, contact the customer, or escalate.
Study Stripe for status chips and drill-downs, Plaid for health states and error rates, and BILL and Ramp for owner-based queues. If you operate embedded payments, where your own customers or sub-merchants see their own balances and payouts, add a role-scoped view for each of them. Confirm the permission model before launch.
Fintech dashboard design patterns that work
- Color means state, nothing else. Reserve green, red, and amber for gains, losses, and warnings.
- Numerals are the typography that matters. Tabular figures, consistent decimals, right-aligned columns.
- Design the pending state. Vague “processing” labels create support tickets. Show a timeline with expected completion.
- Show data freshness. Put a last-updated timestamp next to key numbers and flag stale or incomplete data.
- Connect insight to a safe action. A balance should lead to a transfer, a flagged charge to a card freeze. Irreversible actions need confirmation and permission checks.
- Put trust in microcopy. Fees before confirmation, exact timestamps, explicit exchange rates.
- Show insured status carefully. In the United States, standard FDIC deposit insurance covers up to $250,000 per depositor, per insured bank, per ownership category. If you display it, say who holds the funds.
- Keep states consistent. Empty, loading, error, and success states should look the same everywhere.
Worked example: choosing patterns for a small-business payables tool
Say you’re designing a dashboard for an office manager who pays 40 vendors every two weeks.
- Main question: will this payment run go out on time?
- First on screen: run status, next pay date, total due.
- Blockers together: missing bank details, failed payments, and unapproved bills all stop the same run, so show them in one list.
- States: scheduled, processing, paid, failed, needs attention.
- Patterns to borrow: BILL’s status timeline, Ramp’s work queue, Stripe’s drill-down from summary to record.
Each step answers the previous question: “5 bills need attention”, then which five, then what’s wrong with one.
Performance and accessibility benchmarks
| Metric | Target | Source |
|---|---|---|
| Largest Contentful Paint | 2.5 seconds or less | Google Core Web Vitals |
| Interaction to Next Paint | 200 milliseconds or less | Google Core Web Vitals |
| Cumulative Layout Shift | 0.1 or less | Google Core Web Vitals |
| Normal text contrast | At least 4.5 to 1 | WCAG |
| Large text contrast | At least 3 to 1 | WCAG |
If your dashboard handles card data, check your scope against PCI DSS, whose future-dated v4.0 requirements became mandatory on March 31, 2025.
Light or dark: choosing a theme for financial data
| Product situation | Better default | Why |
|---|---|---|
| Trading and treasury tools | Dark | Long sessions, dense real-time data |
| Occasional-use business banking | Light | Familiar and easier for casual users |
| Developer consoles | Both | Users pick their environment |
| Billing and invoicing | Light | Documents and exports are usually light |
Support both themes where you can, and test each against contrast requirements.
How to test a fintech dashboard before launch
- Functional. Test calculations, end-to-end data flows, common workflows, and peak transaction load.
- Security. Verify role-based access, session behavior, input validation, and protections around high-risk actions. Review audit logs and encryption.
- Usability. Run task-based sessions with real roles. Test keyboard navigation, screen readers, and currency and date formats.
- Data safety. Use synthetic or anonymized data in test environments.
- After launch. Review on a schedule and re-test whenever rules change.
Where to find more fintech dashboard inspiration
If you want more visual references, browse curated design galleries such as Godly and SaaS Frame, or designer portfolios on Dribbble and Behance. Use them for layout ideas, not as proof of how a product performs. For presentation visuals such as financial dashboard illustrations on a fintech marketing site, keep them simple, avoid fake charts that mislead, and use licensed assets only. Make sure any screenshots you use are your own or properly licensed.
Template or custom build: how to decide
| Option | Best for | Watch out for |
|---|---|---|
| Community Figma files | Fast concept and stakeholder review | Layouts may ignore real data density |
| Open-source GitHub starters | Prototypes and internal tools | License, maintenance, dependencies |
| Free admin templates | Basic layouts and charts | Rarely include security or audit features |
| Premium fintech themes | Faster launch with polished UI | Customization limits and license terms |
| Custom build | Complex workflows and compliance | Higher upfront effort |
Checklist before choosing a template
- Does the license allow commercial use?
- Are tables sortable, filterable, and keyboard accessible?
- Do charts handle currency formats and negative values?
- Is each theme tested for contrast?
- Is the codebase actively maintained?
- Who owns security review, audit logging, and role permissions?
Signs a template won’t be enough
- Your dashboard must reconcile with a ledger, not just display numbers.
- Approval rules change by amount, team, or region.
- You operate in a regulated vertical such as lending or insurance.
- You want analytics on top of live finance data. See business intelligence for finance.
How a fintech dashboard is built: reference architecture
| Layer | Responsibility | Typical components |
|---|---|---|
| Presentation | Screens, charts, tables, themes | Web front end, component library, charting |
| API | Secure access to data and actions | REST or GraphQL, authentication, rate limits |
| Business logic | Rules that define your product | Approval limits, fees, payment schedules |
| Data and ledger | System of record | Relational database, double-entry ledger, audit log |
| Integrations | Outside systems | Banks, processors, accounting tools, identity checks |
| Security and compliance | Controls across every layer | Role-based access, encryption, logging, PCI DSS scope |
Data flows in a consistent order: user action → API → permission check → business rule → ledger write → audit log and notification → dashboard refresh. Templates cover only the first row. The rest is where cost, risk, and compliance live. For scaling these layers, see microservices architecture in financial services. Teams automating approvals and reconciliation can also look at intelligent automation in banking and RPA in finance.
Conclusion
The best fintech dashboard design examples share one habit: they answer the user’s first question in seconds. Mercury does it with calm, Stripe with clear tables, Ramp and BILL with queues and trails, Brex with exceptions, Wise Business with honest fees, Revolut Business with readable numerals, Plaid with visible health, and Robinhood with restraint.
Use them as taste references, not blueprints. Templates can speed up screens, but the ledger, rules, integrations, and security underneath decide whether users trust the product. If your workflow is too specific for a template, book a free scope review with DevSouq’s finance software team. We’ll show you which parts to reuse and which to build around your own data. If you’re still comparing partners, read how to choose a custom software development company.
FAQs
What makes a good fintech dashboard design?
A good fintech dashboard design answers one question fast: is my money okay? It leads with a balance or net position, shows pending items next, uses color only for status, and keeps tables easy to scan. Clear fees, exact timestamps, and a last-updated label add the trust people expect when money is involved.
What should a banking dashboard show?
A banking dashboard should show total balance with a trend, money in motion such as pending payments, a cash flow chart, a filterable transaction table, and alerts for failed or flagged items. Anything that changes the balance should be visible on the first screen, without extra clicks or menu digging
Which fintech has the best dashboard design?
There is no single winner. Mercury is a strong pick for calm business banking, Stripe for payment tables and reporting, Wise Business for fee transparency, and Ramp for workflow-first spend management. The best choice depends on your audience, so match the reference to your product type and your users’ first question.
Should a fintech dashboard be dark or light?
Dark suits trading and treasury tools used for long sessions with dense real-time data. Light suits occasional-use business banking, billing, and invoicing, where documents and exports are usually light. If you can, support both themes and test every text color against the 4.5 to 1 WCAG contrast minimum.
Are there fintech dashboard templates I can build from?
Yes. Community Figma files, open-source GitHub starters, free admin templates, and premium fintech themes all give a head start on screens. They rarely cover ledger logic, approval rules, audit logging, or security, so check licenses, accessibility, and maintenance first, and consider a custom build for complex or regulated workflows.
What should a payment monitoring dashboard show?
It should show payment status and volume, failure and decline reasons, trends over time, and when funds will arrive. Each failed payment needs an owner, a timestamp, and a clear next action such as retry or contact the customer. Surface these on the main view so teams spot problems before customers report them.