Quick Answer:
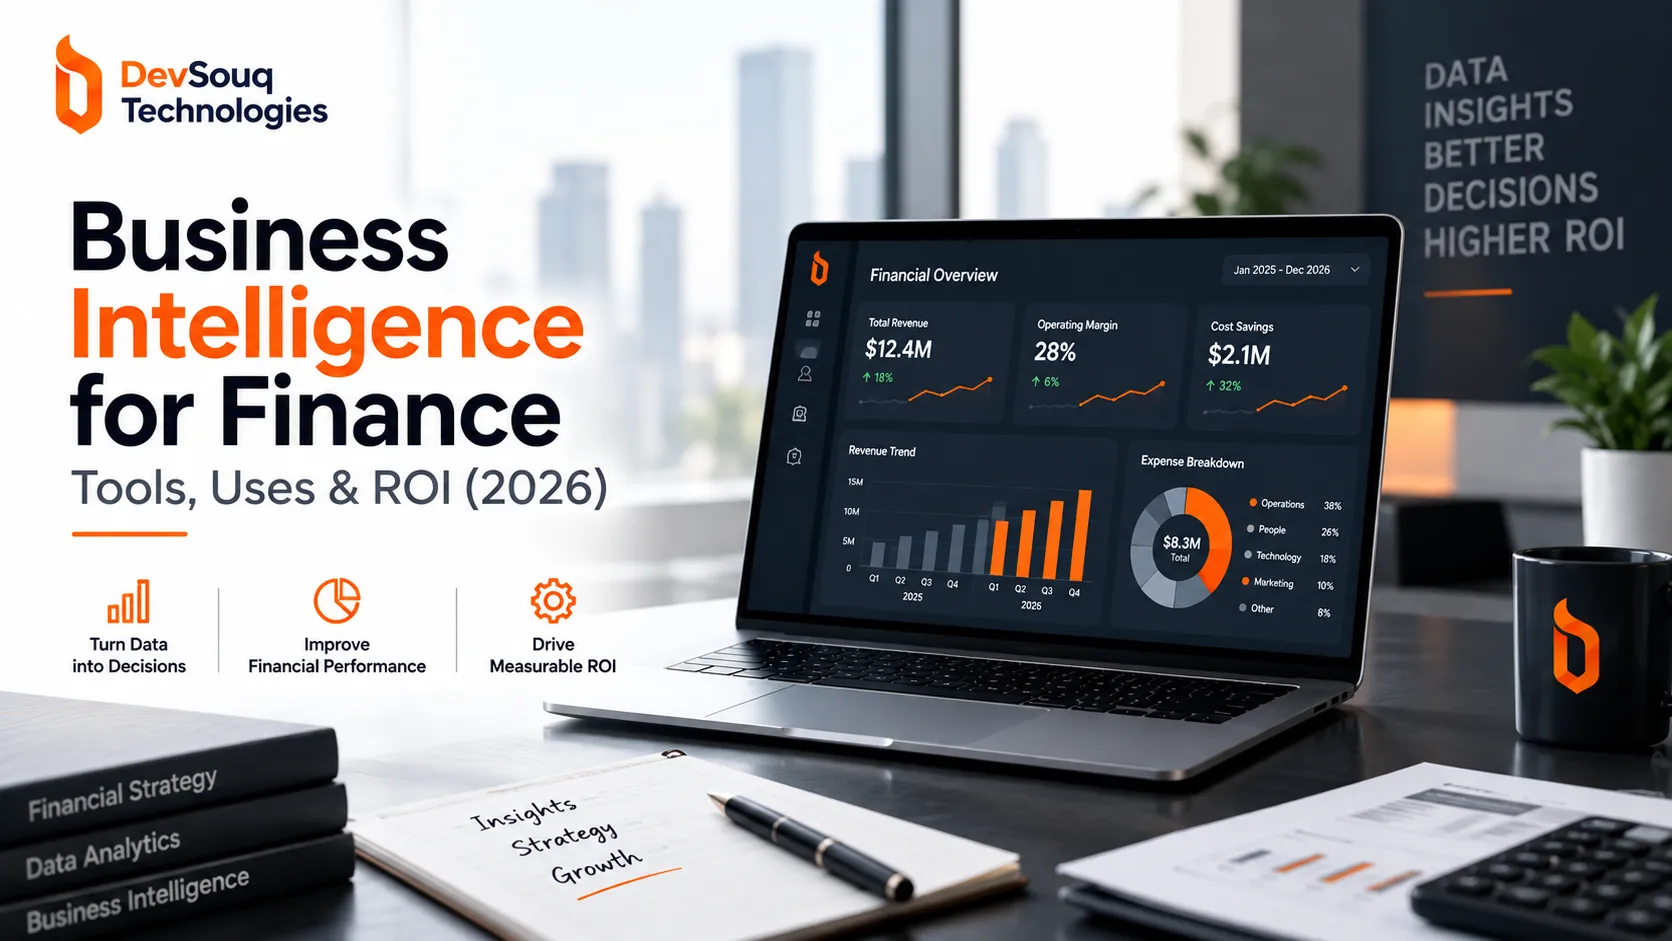
Business intelligence for finance turns your accounting, banking and transaction data into live dashboards and forecasts, so you catch problems and make decisions in real time, not weeks later.
Want to know where your own data stands? DevSouq offers a free scope review to show you exactly where BI would help most.
Key Takeaways
- BI for finance turns raw data into live dashboards, replacing reports that are already weeks old.
- Mistakes carry higher stakes here a bad transaction can trigger compliance issues or missed fraud, not just a bad report.
- The biggest wins come from performance tracking, cash flow, profitability, fraud detection, and compliance reporting.
- Governance and clean data must come before wide rollout, or self service just creates more inconsistent numbers.
- Weak adoption, not weak software, is the most common reason BI programs fail.
- Cost depends more on data complexity than on which tool you choose.
What Is Business Intelligence for Finance?
Business intelligence for finance is the practice of collecting, organizing, analyzing and visualizing financial data so that finance leaders, controllers, analysts and executives can make decisions based on current, accurate information rather than a static report from the last close cycle. It pulls together data from accounting systems, core banking platforms, ERP software, CRM records and market feeds, then standardizes that data into consistent metrics that everyone in the organization reads the same way.
The discipline covers four connected pieces:
- Data integration, pulling records from every system that touches money into one governed source
- Financial modeling, building the logic that turns raw transactions into metrics like margin, working capital or return on equity
- Analysis, applying statistical methods and, increasingly, machine learning to detect trends, anomalies and risk
- Visualization and reporting, presenting the results as dashboards, scorecards and automated reports that non technical stakeholders can actually use
Finance BI differs from business intelligence in other departments mainly because of what happens when it goes wrong. A misread marketing segment costs a weak campaign. A misclassified transaction in finance can trigger a compliance violation, a failed audit or a fraud loss that goes undetected until it is much larger. That is why finance BI is built on auditable pipelines, strict access controls and a much lower tolerance for unverified data than most other business functions.
Companies building or buying custom finance software often bake BI directly into the platform, connecting reporting and analytics to the same data layer that runs core operations, rather than bolting a separate tool on afterward.
Why It Matters for Finance Teams Today

A decade ago, most finance reporting ran in batch cycles, overnight jobs that produced numbers the next morning. That cadence no longer matches what the business, regulators or customers expect. Credit decisions that used to take days now close in hours. Liquidity positions that once updated overnight refresh continuously. Fraud detection increasingly happens in milliseconds rather than during a nightly reconciliation run.
The pressure comes from multiple directions at once:
- Customer expectations have shifted. A borrower who gets a decision in minutes from one lender will not wait several days for another.
- Regulatory timelines are tight and specific. Surveillance and compliance reporting require auditable, traceable data on fixed deadlines, not best effort estimates.
- Competitive pressure is measurable. Industry research on analytics driven automation points to operating cost reductions of up to twenty percent for firms that successfully operationalize it, and roughly two thirds of financial institutions say acquiring data, analytics or AI capability is now a top factor when they evaluate acquisitions.
Despite that pressure, a meaningful share of finance and banking leaders still describe their own data as a liability rather than an asset. Survey data from the banking sector consistently shows that a significant portion of executives name the inability to use data effectively as one of their top technology challenges. The firms closing that gap are the ones treating BI as core infrastructure rather than an optional reporting layer.
Core Use Cases
BI for finance earns its budget when it is pointed at specific, high value problems. These are the use cases that consistently deliver measurable return.
Financial Performance Monitoring and Forecasting
BI dashboards track the metrics finance leaders check most often: revenue, gross margin, operating expense ratio, EBITDA, return on assets and return on equity. Instead of waiting for a monthly close to see whether the business is on plan, finance teams get a live read and can drill into the specific driver behind any variance.
Budgeting and Budget vs Actual Analysis
BI automates the comparison between what was planned and what actually happened, flagging discrepancies as they appear instead of during a quarterly review. Combined with historical trend data, this supports rolling forecasts that adjust as new information comes in rather than staying fixed for an entire fiscal year.
Cash Flow and Liquidity Management
Real time visibility into accounts receivable, accounts payable, cash balances and short term liquidity ratios lets finance teams spot a cash crunch before it becomes an emergency. This is one of the clearest areas where recurring billing software and BI reporting reinforce each other, since subscription and installment revenue depend on predictable, well tracked cash timing.
Profitability and Product Line Analysis
Not every customer or product line is as profitable as it looks on a summary report. BI pulls together revenue, direct cost, support cost and capital cost data to show true margin by product, branch, channel or customer segment, which is where a lot of hidden inefficiency gets found.
Risk Assessment and Fraud Detection
Risk teams use BI to track borrower creditworthiness, market exposure and liquidity risk by combining internal transaction history with external sources like credit bureaus. Industry research from the Institute of International Finance found that risk management is the leading use case financial institutions cite for predictive AI, and Mastercard research found that a substantial share of card issuers saved multiple millions of dollars in prevented fraud over a recent two year period through AI powered detection. For firms handling loan servicing or claims management, this kind of pattern detection is often where BI investment pays back fastest, since both loan defaults and fraudulent claims show up as anomalies in transaction data well before they show up on a balance sheet.
Customer Segmentation and Personalization
BI moves segmentation beyond broad demographic buckets into precise, behavior based groupings, often by combining internal transaction data with external signals. Some banks have expanded from a few hundred customer experience use cases to well over a thousand within a few years by applying this approach systematically.
Compliance and Regulatory Reporting
BI creates the audit trails and consistent metric definitions that regulators expect, and automates much of the reporting that would otherwise consume analyst time every cycle. This is especially relevant for insurance billing platforms, where claims, premiums and payouts all carry separate regulatory reporting obligations.
Performance Benchmarking
BI supports systematic comparison of branches, advisors, products or business units against both internal targets and external market peers, often surfacing underperformance that had previously only been suspected anecdotally rather than proven with data.
Key Benefits
| Benefit | What Changes in Practice |
|---|---|
| Faster decisions | Executives see current numbers instead of a report that is already weeks old |
| Fewer manual errors | Automated data collection removes repetitive manual entry and reconciliation |
| Stronger risk control | Anomalies and fraud patterns surface before losses materialize |
| Better forecasting | Rolling, data backed forecasts replace static annual budgets |
| Shared source of truth | The CFO, controller and business unit heads look at the same number, calculated the same way |
| Improved collaboration | Teams stop maintaining competing spreadsheets and work from shared dashboards |
Working with an experienced custom finance software development company like DevSouq can help teams reach these benefits faster, since a BI layer designed around a firm’s actual data model tends to need far less rework than a generic dashboard tool bolted onto legacy systems later.
Essential Tools and Technology Stack
A finance BI program typically rests on six layers of technology, each solving a different part of the problem.
BI and Visualization Platforms
Tools like Microsoft Power BI, Tableau, Qlik Sense and Looker turn governed data into dashboards, scorecards and self service reports. Most enterprise platforms now include natural language querying, letting non technical users ask a question in plain English and get an answer without writing a query.
Data Warehouses and Data Lakes
Cloud based warehouses hold the cleaned, governed data that everything else depends on. They connect directly to market data providers and support the heavier analytical workloads, like risk modeling, that a simple dashboard tool cannot handle on its own.
Master Data Management Tools
MDM keeps reference data (customer identities, product definitions, counterparty records) consistent across every system that touches it. Without this layer, the same customer can appear as several different records, quietly breaking any report that tries to sum activity per customer.
ERP Systems
ERP platforms integrate finance, procurement and operations data. Many modern ERP systems built for financial services now embed analytics and AI natively, which reduces the manual reconciliation that used to eat up close week entirely.
Analytics and Predictive Modeling Platforms
Data science platforms support credit risk scoring, behavioral analysis and predictive modeling. This is where machine learning has the most impact, though regulators increasingly require that these models stay explainable and auditable rather than acting as a black box.
ETL and Integration Pipelines
Extract, transform, load tools ingest data from core banking systems, CRM platforms and market feeds and standardize it into an analytics ready layer. Nothing downstream works reliably if this layer is unreliable, which is why data engineering talent is often the real bottleneck in a BI rollout, not the dashboard software itself.
Tool selection guide
| Priority | Best fit tool category |
|---|---|
| Self service dashboards for non technical staff | BI and visualization platform |
| Consolidating data from ten or more source systems | Data warehouse plus ETL pipeline |
| Duplicate or inconsistent customer records | Master data management tool |
| Credit scoring or fraud pattern detection | Analytics and predictive modeling platform |
| Reducing manual reconciliation across departments | ERP with embedded analytics |
How to Implement BI for Finance: Step by Step
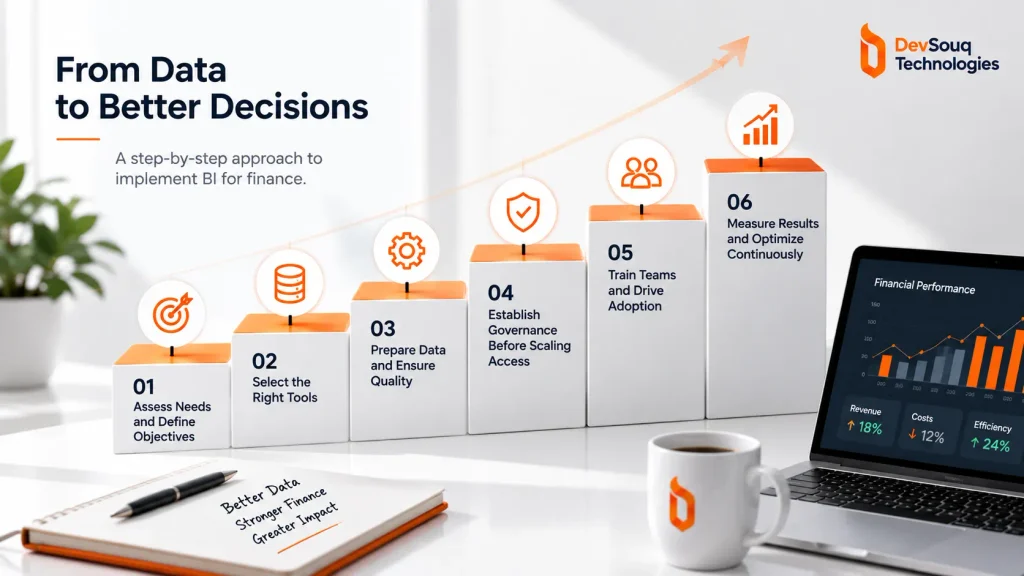
1. Assess Needs and Define Objectives
Start by naming the specific outcomes BI should deliver, such as cutting close time, reducing fraud losses or improving forecast accuracy, rather than treating the rollout as a generic technology purchase. Involve finance, IT, risk and compliance stakeholders early so the objectives reflect real operational pain points, not just what a vendor demo made look impressive.
2. Select the Right Tools
Match tool choice to your objectives and existing systems. A firm running custom accounting software needs a BI layer that integrates cleanly with that system, not a generic dashboard tool that requires constant manual exports. Consider scalability, ease of use for non technical staff and how well a vendor’s roadmap covers AI capability, since that gap is widening quickly between platforms.
3. Prepare Data and Ensure Quality
Identify every relevant data source, internal and external, and build a repeatable process for integrating and cleaning it. This step is unglamorous and frequently underestimated, but nothing downstream, from dashboards to fraud models, performs reliably on top of dirty data.
4. Establish Governance Before Scaling Access
Set access controls, quality standards and clear ownership for each dataset before opening self service tools to a wide group of users. Governance introduced after wide rollout is far harder to retrofit than governance built in from day one.
5. Train Teams and Drive Adoption
The most capable BI platform delivers nothing if finance staff keep working from personal spreadsheets out of habit. Invest in role specific training, gather feedback early, and highlight quick wins to build momentum rather than mandating a switch overnight.
6. Measure Results and Optimize Continuously
Track the objectives defined in step one: forecast variance, close time, fraud losses prevented, report turnaround. Review regularly and treat the rollout as an ongoing practice, not a project with a fixed end date.
Common Challenges and How to Solve Them
Unreliable or fragmented data. Inaccurate, incomplete or inconsistent data undermines every report built on top of it. A documented data quality framework, covering assessment, standardization and ongoing profiling, addresses this at the source rather than patching symptoms downstream.
Uneven data governance as access widens. Broad self service access increases the risk of inconsistent metrics and ungoverned queries. Role based access, data masking for sensitive fields and a full audit trail keep democratized data safe without slowing teams down.
Weak adoption. Staff often default back to familiar spreadsheets unless training and communication are deliberate and ongoing. Monitoring usage patterns, offering role specific training and demonstrating early wins tend to move adoption faster than a mandate alone.
Integration gaps between legacy systems. Core banking, CRM and accounting platforms that were never built to talk to each other create silos that no dashboard can fully paper over. Prioritizing integration work, rather than layering yet another reporting tool on top of disconnected systems, tends to solve more of the underlying problem.
Cost Factors to Consider
BI implementation cost varies widely based on a handful of factors worth pricing out before committing to a platform:
- Number and complexity of data sources, including how flexible each one is to integrate and where it is hosted
- Data volume, structure and quality, since messy or unstructured data adds meaningful cleanup cost
- Storage layer complexity, including whether the architecture needs a full enterprise data warehouse or lighter data marts
- Analytics complexity, particularly whether machine learning, real time processing or streaming analytics are required
- Visualization and reporting needs, including embedded reporting, mobile support and custom visualization
- Security and compliance requirements, which tend to be higher in finance than almost any other industry
For firms weighing whether to buy an off the shelf platform or invest in a purpose built solution, for example around investment portfolio management software, the cost comparison usually comes down to how much the generic tool would need to be customized anyway. A scope review with an experienced development partner is often the fastest way to get an accurate estimate rather than guessing from vendor list pricing alone.
FAQs
What is business intelligence for finance?
It is the practice of turning financial data such as transactions, accounting records and banking feeds into dashboards, reports and forecasts that support faster, more accurate financial decisions.
How is BI different from general data analytics in finance?
BI focuses on standardized reporting and dashboards for ongoing decisions, while broader financial data analytics can include deeper statistical or predictive work aimed at one off questions.
What tools are commonly used for BI in finance?
Common tools include Power BI, Tableau, Qlik Sense and Looker for visualization, paired with a data warehouse and ETL pipeline for integration.
Can small or mid sized finance teams use BI?
Yes. Cloud based BI tools have made self service reporting accessible without large upfront infrastructure investment, so smaller teams can start with a narrow, high value use case.
Does adopting BI require replacing existing systems?
Usually not. Most BI platforms connect to existing accounting, ERP and CRM systems rather than replacing them, though data quality in those source systems still needs to be solid.